

Identifying and monitoring changes in the pattern of water resources and associated extremes across local to global scales provides evidence to help safeguard lives, livelihoods and ecosystems. The latest State of Global Water Resources report released on 17 September 2026 by the World Meteorological Organization provides a global scientific assessment of the year 2025 in context to the five-year period from 2021 to 2025.
The report, now in its 5th iteration, is a technical assessment rather than a forecast or a set of policy recommendations and combines ground observations, information from global hydrological modelling systems and satellite observations to assess water storage on land including discharge from rivers, groundwater, lakes, snow and glaciers. Its purpose is to establish what has already happened, clearly enough to be used as a basis for planning. For water authorities, planners and organisations preparing for climate risk, the value lies in that consistency.
The report finds that approximately 36 per cent of the assessed global catchment area recorded normal annual river discharge in 2025, while a similar percentage was below normal and just over 20 per cent above normal. This continues a seven-year pattern in which the share of catchment area with normal river flows remained below the 1991–2020 average of 46 per cent.
Satellite records help fill critical monitoring gaps
Against this background, European Space Agency’s (ESA) Climate Change Initiative (CCI), which develops long-term global satellite records for a suite of essential climate variables, contributes observational data on lakes and snow to the report.
“Long-term satellite records allow us to compare lake conditions across regions and over time. They provide a consistent and integrated view of changes that complement ground measurements, they are particularly useful in data scarce area,” says Dr Clement Albergel, Head of ESA’s Actionable Climate Information Section.
The report uses satellite observations for 75 selected lakes and reservoirs. The lake datasets are provided by an ESA-funded research team, led by Collecte Localisation Satellites in France and contributing to ESA’s CCI. The data includes information on the important lake variables water level, surface temperature and ice-cover duration. Tracking these variables provides a consistent picture of water inputs and losses, lake processes, and seasonality.
Lake records show contrasting conditions
Water levels in several African lakes and reservoirs were reported to be much higher than normal in 2025, while the level of Kariba Reservoir was much lower. Across Canada, selected lakes generally recorded below- or much-below-normal water levels. Ice cover lasted for less time than usual across many assessed lakes in Eurasia and North America.
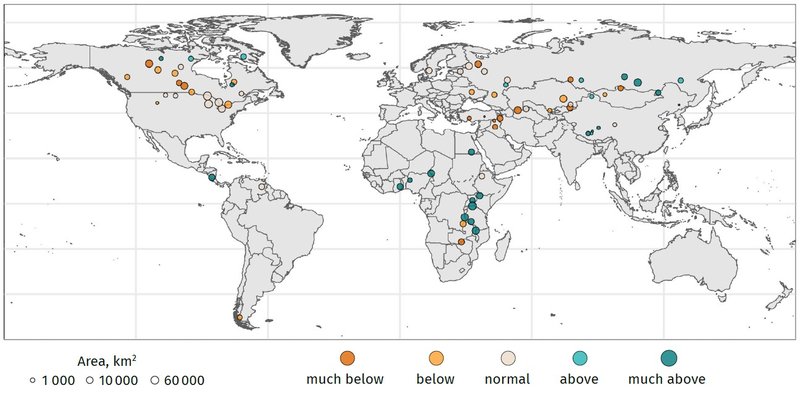
One of the most striking observations reported related to lake surface temperature. In July, most African lakes assessed were much warmer than normal, while Lake Chad was much colder than normal. Lake Malawi shifted from much-above-normal temperatures in January to much-below-normal temperatures in July. These differences show why lake water level, temperature and ice cover need to be assessed together. As a consequence of human-caused warming, lakes are anticipated to become hotter for longer periods by the end of the 21st century and experience more frequent and severe heatwaves, according to earlier ESA CCI-funded research.
“Satellites make it feasible to identify changes in individual lake properties, establish whether they are persistent and help determine whether conditions differ between regions and where further monitoring is required,” says Albergel.
Snow stores water for later
Snow is a seasonal water store. It holds water through winter and releases it as meltwater in spring and summer – a source of freshwater for local communities, for agriculture and ecosystems. Scientists measure this store as snow water equivalent (SWE): the depth of water that would remain if the snowpack melted completely.
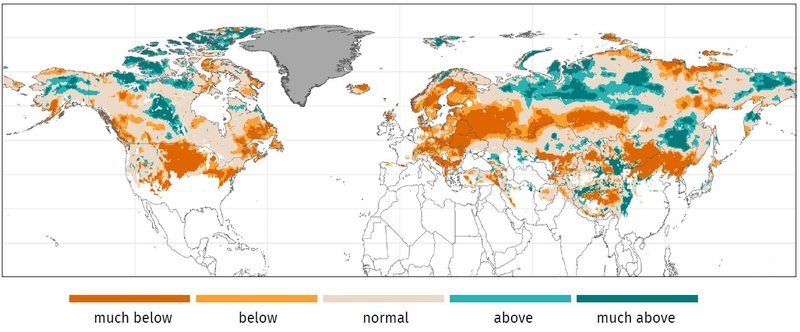
For the March 2025 snow water equivalent assessment, which the report looks at, the WMO combined four gridded datasets. Version 3.1 of the CCI snow water equivalent dataset was one component of that ensemble. The CCI dataset combines passive microwave satellite observations with ground-based snow depth measurements. It provides daily estimates of the snow water equivalent in the Northern Hemisphere at a resolution of 0.1°, approximately 10x10 km, covering the period from 1979 to 2022. The report regridded and averaged all four products before comparing the SWE conditions in March 2025 with those in the 1991 to 2020 reference period.
Across eastern, western and northern Europe, both March snow water equivalent and seasonal peak snow mass were below normal. Less water than usual was held in the snowpack, which can affect how much meltwater reaches rivers, reservoirs and soils later in the year, and when.
Stronger evidence base for water decisions
By showcasing the value of integrated assessments, decision makers can see how national observations, global hydrological models, and satellite data can support policy development and resilience planning. Research teams are developing records to address multiple Essential Climate Variables, including several key to water monitoring, such as soil moisture, river discharge and anthropogenic water use as part of ESA's Climate Change Initiative.