
For the first time, scientists are now able to trace global fire activity throughout the entire industrial age. A newly published dataset uses a combination of satellite observations from the ESA's Climate Change Initiative and advanced machine learning to reconstruct how much land was burned by wildfires worldwide between 1901 and 2020.
Reconstructing historical fire data advances climate research
Fires are a key driver of the global carbon cycle, releasing carbon dioxide into the atmosphere and affecting vegetation recovery. Long-term data records are essential for testing and improving fire models that help scientists to understand carbon dynamics and quantify their emissions more accurately.
To create this long-term dataset, researchers used the Climate Change Initiative's satellite-based burned area product FireCCI51. As the dataset is based on actual observations it provides the empirical measurements as a foundation to train machine learning models which in turn recreate fire patterns back to 1901. This is a transformative development for climate research, as scientists can now test fire models against 120 years of data covering every location on Earth at a resolution of 50 kilometres. The research in effect has extended the fire record to cover an 80-year period preceding the satellite-era.
"Until now we've lacked the data to truly understand how fire has shaped our planet throughout the industrial era," says Stephen Sitch, Professor of Physical Geography at the University of Exeter and co-author of the study. "This reconstruction has immediate practical applications. We can now better estimate historical carbon dioxide releases from wildfires and refine global carbon budgets as well as inform future prevention strategies by revealing shifting fire patterns across regions, informing prevention strategies."
Africa dominates 120 years of fire activity while extreme events drive 60% of burned area
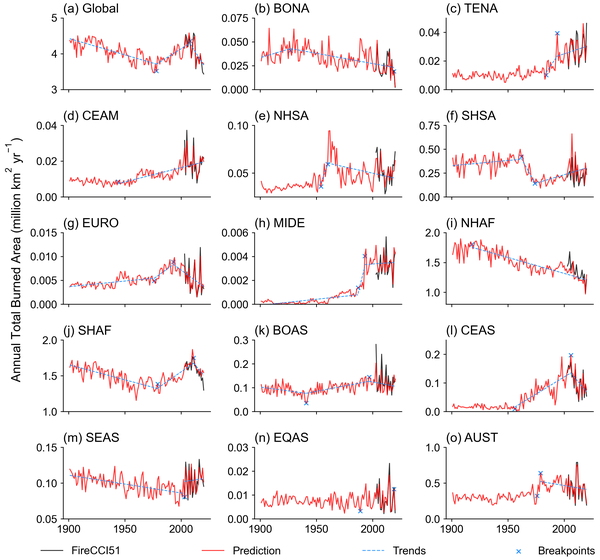
The reconstruction reveals century-long global fire patterns. Global burned area decreased from 1901 to 1978, followed by a significant increase from 1978 to 2008, and then a sharp decline from 2008 to 2020 – the steepest change of the entire period.
Africa was the continent with the largest burned area globally during 1901-2020, to dominate the global trend. Northern and Southern Hemisphere Africa were the top two regions with the largest annual total burned area throughout this period.
A key methodological innovation significantly improved accuracy: the researchers tracked extreme fires and regular fires separately, defining extreme fires as those exceeding the 90th percentile of burned area in each region. When modelled together, abundant moderate fire events statistically drown out the extremes, causing models to systematically underestimate total burned area. Notably, extreme fires account for approximately 60% of all burned area globally, highlighting the outsized impact of the most severe fire events.
"Long-term data on global wildfire evolution is crucial not only for understanding the global carbon cycle, but also for accurately assessing specific influences like Africa's and extreme fires dominant role in shaping worldwide fire trends," notes Dr. Philippe Ciais from France's Laboratory of Climate and Environmental Sciences and co-author of the study. "These insights into how fire patterns have evolved over more than a century and their far-reaching impacts on our climate system would simply not be possible without the robust data generated through the Climate Change Initiative's consistent satellite observations."
Full paper: Guo, Z., Li, W., Ciais, P., Sitch, S., van der Werf, G. R., Bowring, S. P. K., Bastos, A., Mouillot, F., He, J., Sun, M., Zhu, L., Du, X., Wang, N., and Huang, X.: Reconstructed global monthly burned area maps from 1901 to 2020, Earth Syst. Sci. Data, 17, 3599–3618, https://doi.org/10.5194/essd-17-3599-2025, 2025.
Dataset Access: The global monthly fire maps are freely available at https://doi.org/10.5281/zenodo.14191467