
Salinity, or saltiness, at the sea surface is an important driving force behind the conveyor-belt-like ocean circulation patterns that transport heat and carbon around the globe. Tracking this variable is critical for assessing the state of the ocean and also for understanding and forecasting climate phenomena such as the Pacific’s El Niño Southern Oscillation (ENSO) which can disrupt ecosystems, economies and human health.
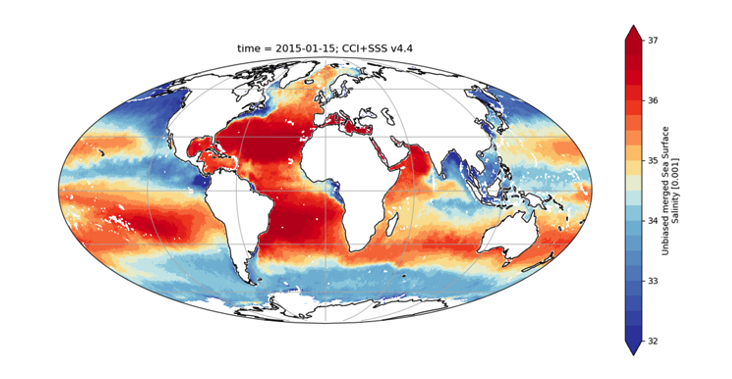
The latest sea surface salinity derived from space has been recently released by researchers contributing to ESA Climate Change Initiative (CCI).
This new product, now in its fourth iteration (version 4.41) covers the period 2010-2022 and integrates measurements from L-band Microwave Imaging Radiometers from ESA’s Soil Moisture and Ocean Salinity (SMOS), and NASA Aquarius and Soil Moisture Active Passive (SMAP) satellite missions into one globally consistent record.
Extended by a further two years the record is available as a weekly and monthly product at ~50km spatial resolution and describes annual and interannual variability at large meso- to basin scales with unprecedented accuracy.
'Enhancements include seasonal bias corrections, stability at high latitudes and significantly improved sea surface salinity coverage in the polar regions,’ explains CCI Salinity project science leader, Jaqueline Boutin of Laboratoire d'Océanographie et du Climat (LOCEAN), France.
In line with a suite of almost 30 other projects comprising ESA’s Climate Change Initiative, this project is dedicated to generating robust, long-term satellite data records for climate applications and takes the Global Climate Observing System (GCOS) as reference. All data are fully-validated and uncertainty characterised into a consistent long-term record and so meets the key requirements that climate scientists consider when selecting which data to integrate into models used to predict future change.
Salinity: improving model outputs
Previous studies have demonstrated that assimilating sea surface salinity data into ocean/atmosphere models improves the representation of the oceans coupled dynamics. Importantly, when combined with observations of other climate variables such as sea surface temperature, the ability to forecast El Niño events improves. For example, model forecasts that use salinity information are useful for seven months, whereas this falls to four months when it is omitted.
El Niño events are associated with a periodic reduction, or switch, in easterly trade winds flow from the Americas to southeast Asia on normal years. This triggers changes in water and ocean surface heat movement and dramatic shifts in weather patterns around the world and a heightened risk of flood and drought extremes.
El nino and monitoring the ocean surface from space
The animation below illustrates how satellite observations of sea surface salinity and sea surface temperature can be used to track the evolution of el Nino events across the Pacific.
According to Roberto Sabia, Earth Observation/Ocean Scientist at ESA, “sea surface salinity is often described as a fingerprint of El Niño. One can track the evolution of historic events by observing low salinity ponds that form over the Pacific due to changes and interplay of precipitation, evaporation and advection currents.
“There are signs in the latest models and in the observed data, that some of these low freshwater ponds could be a precursor of El Niño events."
This new state-of-the-art salinity record enables the scientific community to assess the state of the ocean, monitor variations related to climate variabilities such as El Niño-Southern Oscillation and Indian Ocean Dipole, and investigate the linkage with different elements of the water cycle such as evaporation/precipitation, continental runoff and freezing/melting of sea ice.
| Sea Surface Salinity v4.41 Dataset highlights |
|
|---|---|
| Weekly product: | |
| Timeframe: | 2010-2022 |
| Spatial Resolution: | 50km |
| Sampling | 0.25° grid at 1-day time intervals |
| Monthly Product: | |
| Timeframe: 2010-2022 | 2010-2022 |
| Spatial resolution of 50 km | 50km |
| Sampling | 0.25° grid at 15-day time intervals |
"Our latest sea surface salinity dataset represents a leap forward in global climate monitoring. Its availability on both global and polar grids ensures accessibility and usability for diverse scientific applications." adds Rafael Catany, Project Manager of the CCI Salinity project at ARGANS.
“Improving retrievals of sea surface salinity in polar regions is crucial for better understanding the water cycle, ocean dynamics, and climate change impacts,” he adds.
Both weekly and monthly products are available on a global 0.25° grid and on polar 25km Equal-Area Scalable Earth (EASE) grids. For more detailed information, the user guide and product documentation are available via the ESA CCI Sea Surface Salinity web pages.
Dataset citable as:
Boutin, J. et al. (2024). ESA Sea Surface Salinity Climate Change Initiative (Sea_Surface_Salinity_cci): Weekly and monthly sea surface salinity products, v04.41, for 2010 to 2022. NERC EDS Centre for Environmental Data Analysis. https://dx.doi.org/10.5285/f2ca631f29a24c47a7e98654ddf2c7d9
Alternatively, answer our full survey here [en]!