
Nations around the world are making efforts to reduce emissions of climate warming gases. To track action, countries report their greenhouse gas emissions to the UNFCCC. Researchers have developed a framework using Earth observation satellite data to independently check,
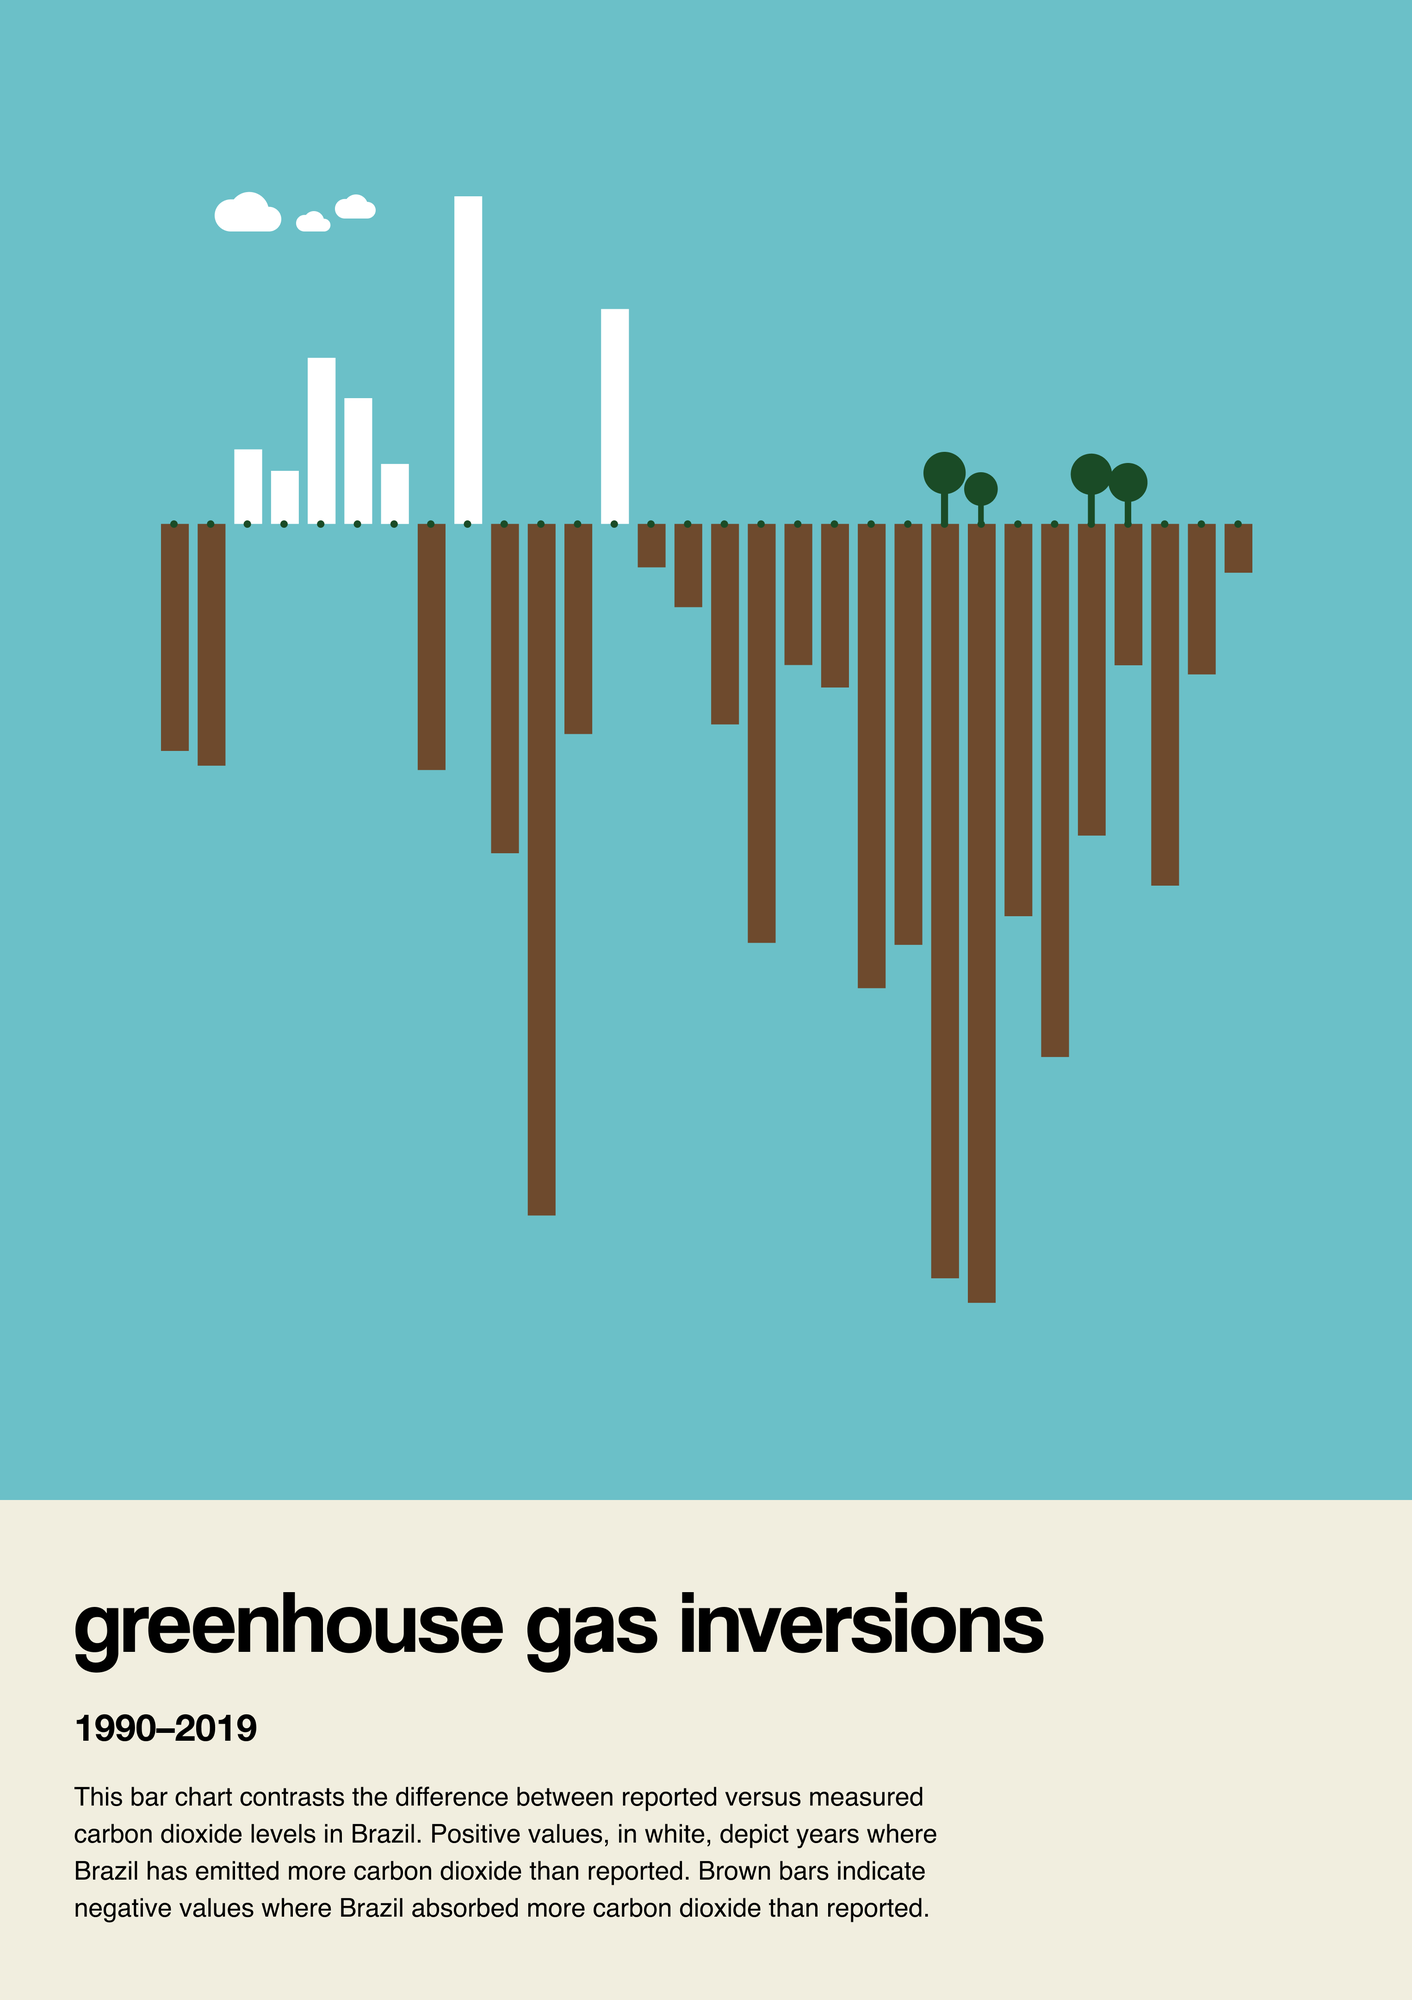
and help improve, national inventory greenhouse gas reports that show progress towards Paris Agreement objectives. This bar chart contrasts reported versus space-derived CO2 in Brazil.
About
The Little Picture visually compares the difference between the reported and actually measured CO2 levels for Brazil (other countries can be created as well. Years with positive values, depicted in white, are emitting more CO2 than they've reported, indicating a surplus released into the atmosphere. Conversely, years with negative values, represented in brown, are effectively absorbing more CO2 than reported, demonstrating a beneficial reduction of CO2 from the atmosphere into the earth or water.uses satellite observations to illustrate the number of lake area across the world's continents.
Data
This Little Picture uses the following datasets:
- Paper source: https://essd.copernicus.org/articles/14/1639/2022/
- Data Source: https://zenodo.org/record/5089799#.ZGTewexByAl (data compressed into a single zip file)
Code
The code and documentation used to build this Little Picture can be found on the following github repository – https://github.com/littlepictures/clip_ghg_inversion_vs_inventory
Licence
This little picture is published under CC BY-SA 4.0 licence.
The big picture
The European Space Agency (ESA), the European Centre for Medium-Range Weather Forecasts (ECMWF), and the European Organisation for the Exploitation of Meteorological Satellites (EUMETSAT) work closely together to measure, process & make space-derived information about the climate available.
ESA
The mission of the Climate Change Initiative (CCI) is to realise the full potential of the long-term global Earth Observation archives that the European Space Agency (ESA), together with its Member states, has established over the past 40 years, as a significant and timely contribution to the climate databases required by the United Nations Framework Convention on Climate Change. The ESA Climate Office provides a free & open CCI data facility bringing together ECV data from across its twenty-seven climate science projects, including a CCI Data Standards and a CCI Toolbox.
ECMWF
The Copernicus Climate Change Service (C3S) supports society by providing freely available authoritative information about the past, present and future climate in Europe and the rest of the World. C3S is one of the six thematic information services provided by the Copernicus Earth Observation Programme of the European Union, and has been entrusted by the European Commission to the European Centre for Medium-Range Weather Forecasts (ECMWF). One of the core components of C3S includes the Climate Data Store (CDS). This is a one-stop shop for climate information. It provides free and easy access to a wide range of climate datasets via a searchable catalogue. A freely available online toolbox allows users to build workflows and applications suited to their needs.
EUMETSAT
EUMETSAT operates missions both to provide weather and climate data for its member states, and as an entrusted entity under the Copernicus programme. Several missions are operated collaboratively with ESA, providing complimentary expertise and data processing, to process and distribute land, marine, and atmosphere relevant products for users. Data from EUMETSAT operated missions is frequently available in near-real-time, facilitating rapid monitoring and forecasting. Via EUMETCast, the EUMETSAT Data Services, or WEkEO, users can access data in ways that suit their needs. The data is used by the EUMETSAT satellite applications facilities, as well as across the various Copernicus Services.
Further Reading
Satellites improve national reporting of greenhouse gases published on esa.int (14 April 2022)
next